Interactive Resources for Schools


This topic takes on average 55 minutes to read.
There are a number of interactive features in this resource:
 Biology
 PSHE / Citizenship studies
 Science (applied)
Biology
Science (applied)
Biology
 Human biology
 Science
Human biology
Biology
PSHE / Citizenship studies
Science
Human biology
Biology
PSHE / Citizenship studies
The onset of type 1 diabetes is rapid and its symptoms are likely to be noticed through:
This form of diabetes develops much more gradually and so symptoms may not be apparent for many years. It is often diagnosed during healthy screening tests where the blood sugar level is found to be elevated despite there being no symptoms of diabetes.
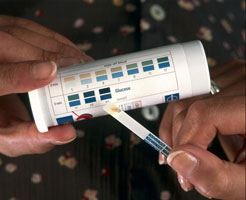
A simple test strip can indicate the presence of glucose in the urine. Image courtesy of: Wellcome Images
Simple blood and urine tests may be sufficient to diagnose diabetes in some people. Others may have to take an oral glucose tolerance test (OGTT) if other blood and urine tests are inconclusive.
Patients are not allowed to eat for at least 12 hours before the test. A blood sample is then taken to measure the patient's fasting blood glucose level.
They are then given a drink containing 75g of glucose. This is quickly absorbed and their blood glucose level is measured over the next two hours.
Plasma venous glucose concentrations used for diagnosis of diabetes:
| Concentration (mmol / l) | |
|---|---|
| Fasting | ≥ 7 |
| 2 hours post-glucose | ≥ 11.1 |
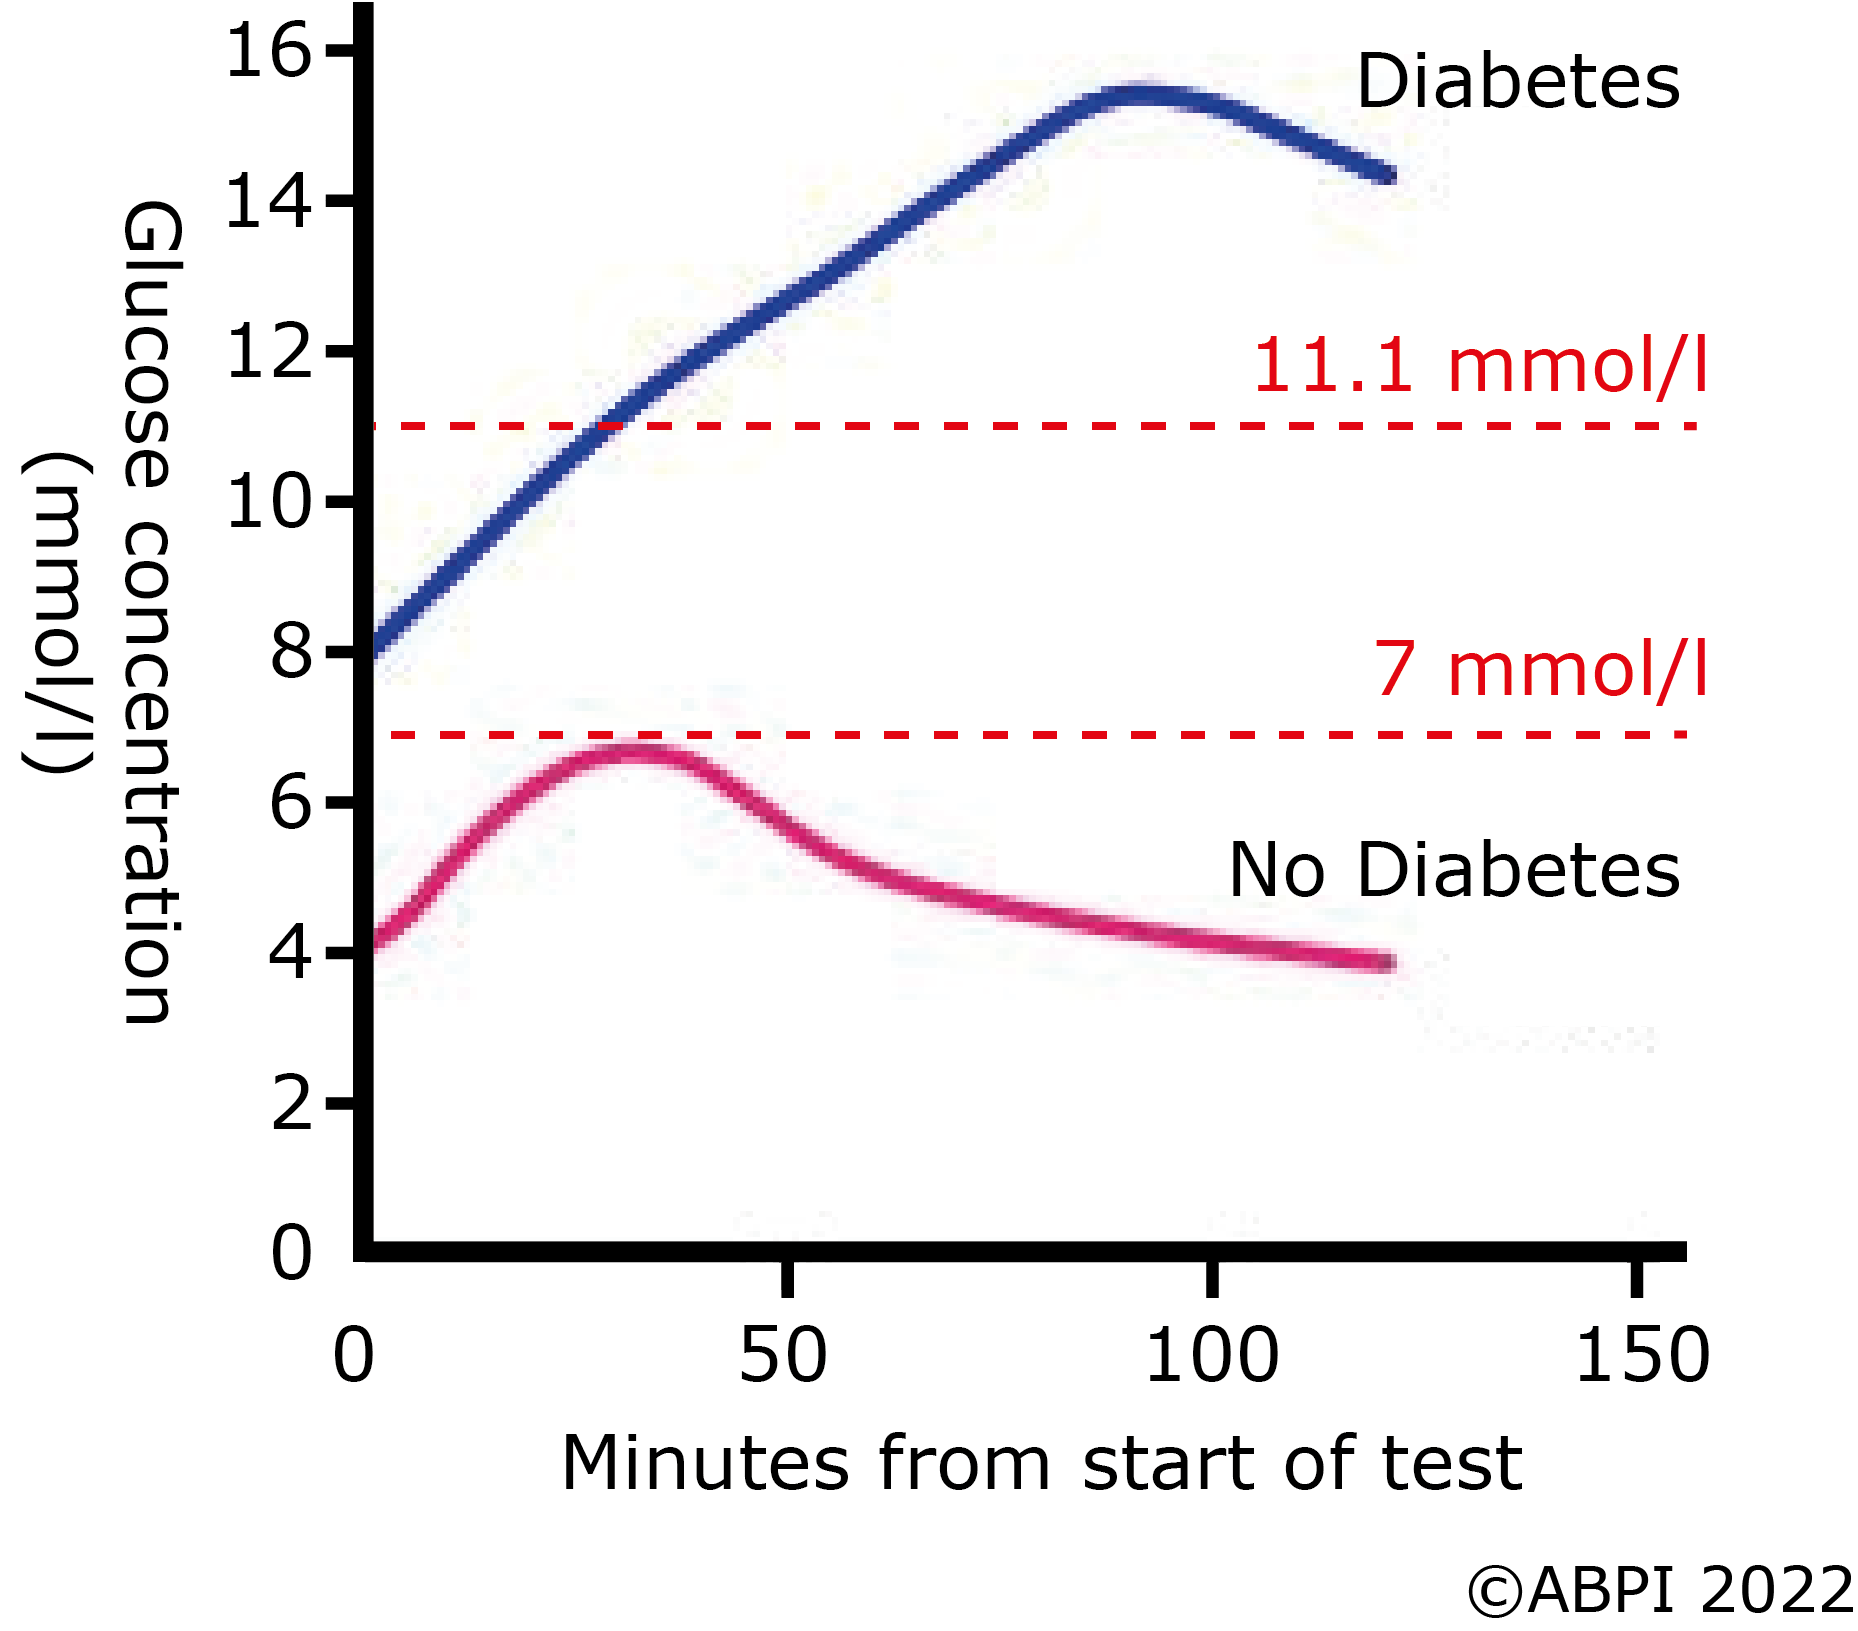
Individuals with diabetes rapidly become hyperglycaemic and their blood glucose level remains above normal. Blood glucose in the person with diabetes rises and stays above normal.
Healthy individuals will release insulin to store the excess glucose and return their blood glucose level to normal. The healthy person regulates their glucose back to normal.
In the UK, there are significant variations in the frequency of type 2 diabetes between different population groups.
Look at the graph and answer the question.
Rates of diabetes in different ethnic groups in England
The graph shows the incidence of diabetes in adults over the age of 16 from different population groups (type 1 plus type 2). Describe the likely factors that influence the different rates of diabetes. Suggest how these factors could be further investigated.
Factors may be:
Further investigations could include: