Interactive Resources for Schools


This topic takes on average 55 minutes to read.
There are a number of interactive features in this resource:
 Science
There are various descriptive statistics we can do on sets of data, common ones include the mean, median and mode. For example, for the following set of data:
2, 4, 4, 7, 9, 10
The mean (x̄) is 6, the median is 5.5, and the mode is 4. While we commonly refer to these three descriptions in interpreting data, they do not tell us much about how ‘spread out’ our data set is. We could have a different data set:
0.2, 4, 4, 7, 9, 11.8
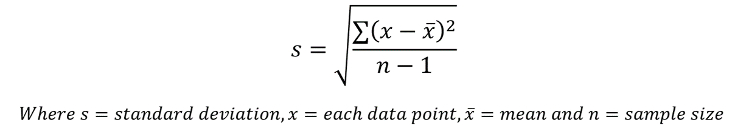
x̄ is still 6, the median is still 5.5, and the mode is still 4. However, the data is more ‘spread out’, that is it has more ‘deviation’ around the mean. It is important that we are able to quantify this deviation for a set of data, and to do this we use standard deviation. The equation to calculate standard deviation for a sample is as follows:
As an example, we will work out the standard deviation of our earlier set of data:
2, 4, 4, 7, 9, 10
By inserting the relevant data points into the equation, our standard deviation currently looks like this:
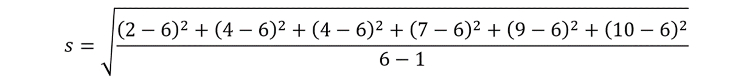
This simplifies to:

Finally, we get our answer of 3.16. This means that we have a standard deviation of the mean of 3.16. Larger standard deviations indicate data that is more spread out, and there is no limit on how big standard deviations can be. However, the smallest standard deviation is 0, for a data set that is perfectly in line with the mean (for example, try calculating the standard deviation of the data set: 10, 10, 10, 10, 10, 10).
Standard deviations are also commonly used to plot error bars on graphs, as seen below.
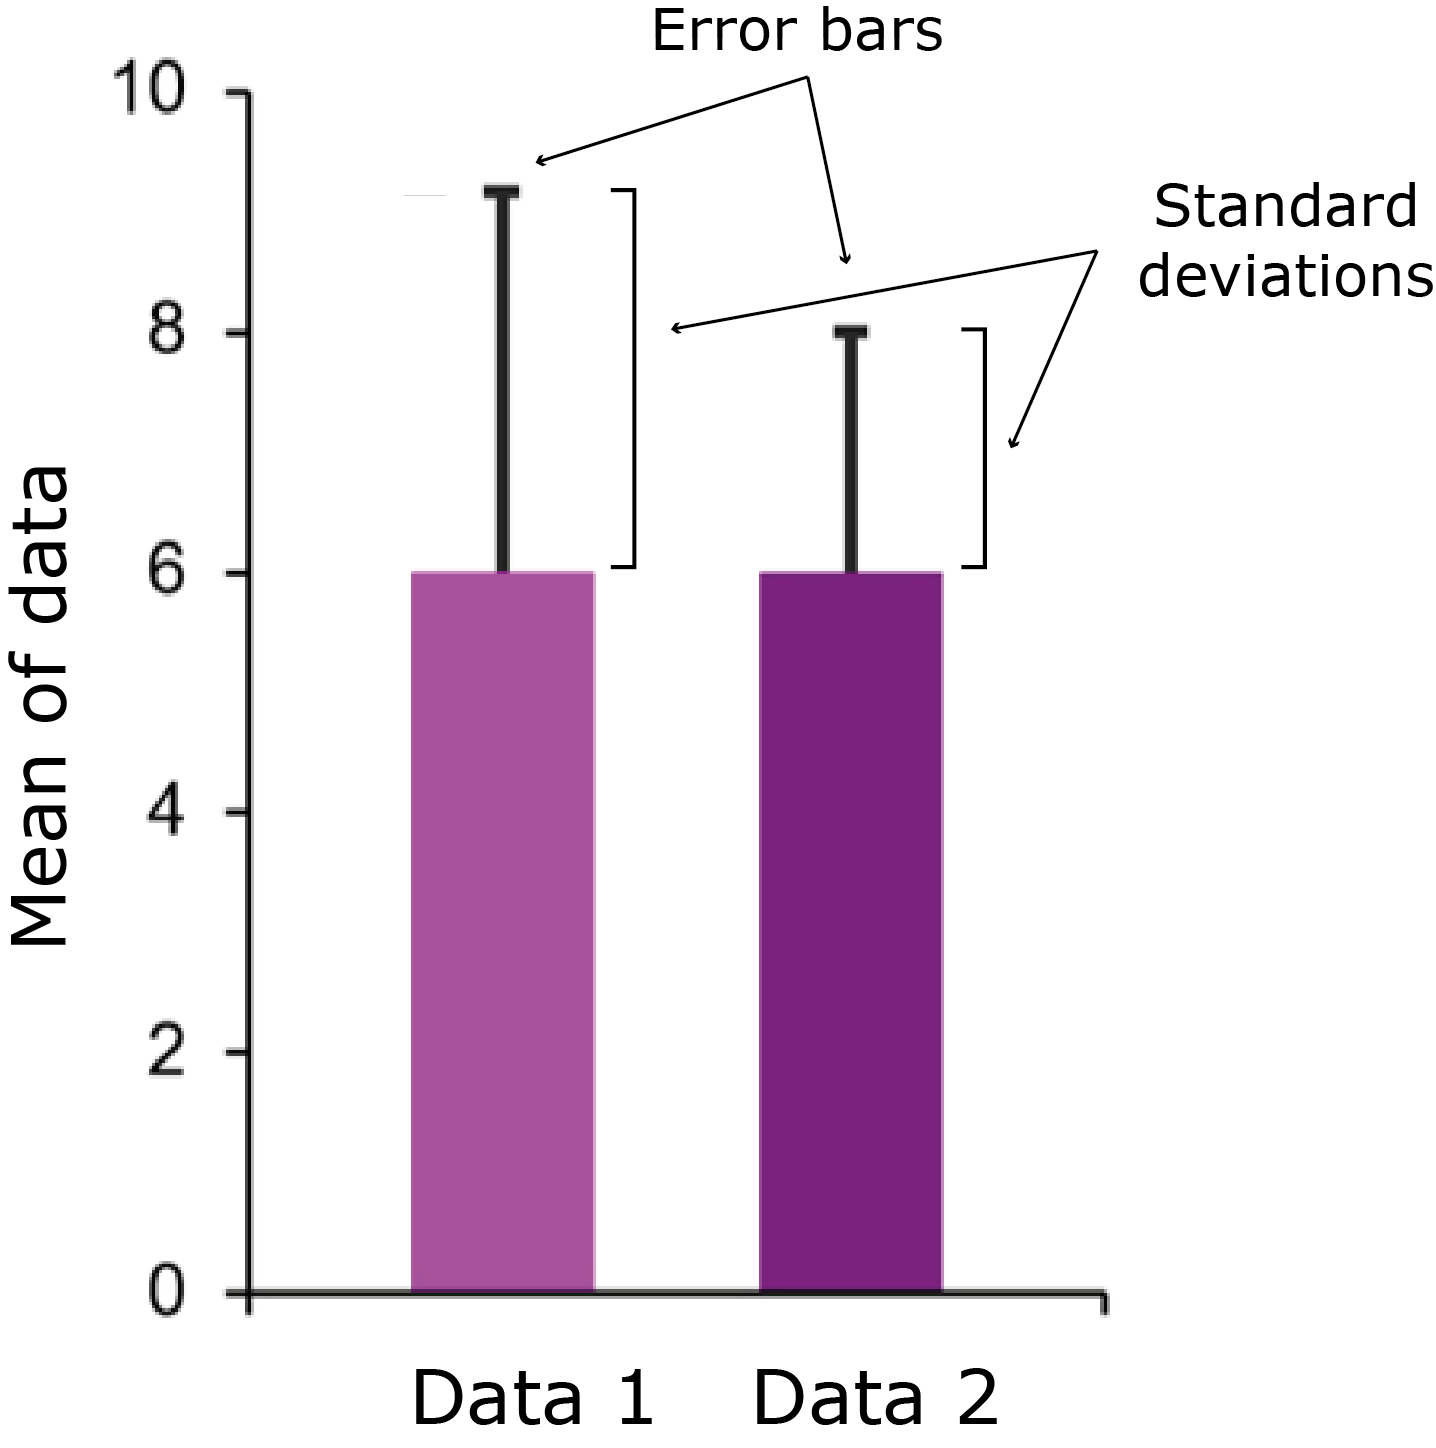
Plotted on this bar chart are two sets of data, which both have means of 6. ‘Data 1’ has a standard deviation of 3.16, and ‘Data 2’ has a standard deviation of 2.00. Error bars extend from the data point upwards one standard deviation, but they can also go in both directions too.